|
A few shots from the first annual THS AP Environmental Science canoe trip down the Tuolumne River. Thanks to the Tuolumne River Trust for providing the guides and canoes for such a unique trip. The students learned a great deal about fluvial processes, the salmon and human influence on the local environment.
1 Comment
My weather station has suffered a malfunction in its thermometer and hygrometer, thus making temperature and humidity readings inaccurate since the Oct 31st storm. Right now the temps are about 8 degrees above actual temperature. Luckily, the rain gauge still works! I'm working on getting a replacement to fill the gap until I get my new Bloomsky Device.
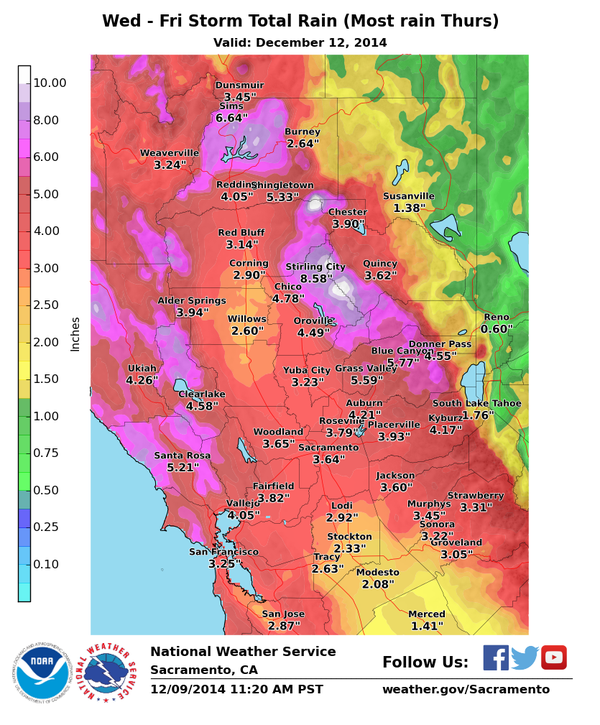
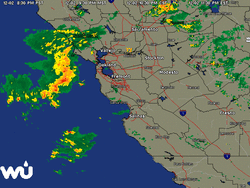
One of the largest storms to hit Northern California in at least six years is headed Turlock's way on Thursday and Friday. Thanks to an atmospheric river of moisture streaming from the subtropical latitudes, two inches of rain and 40+mph wind gusts are forecast to blast Turlock Thursday morning into the early hours of Friday. For rainfall amounts updated every 5 minutes or so, visit the THS weather station button below. To see how the storm impacted our drought, check out my drought monitor on Friday morning. In the meantime, make sure all loose items are indoors so that nothing blows away! For more info be sure to check out the NWS Sacramento & Hanford's twitter feeds for up to date warnings and forecasts
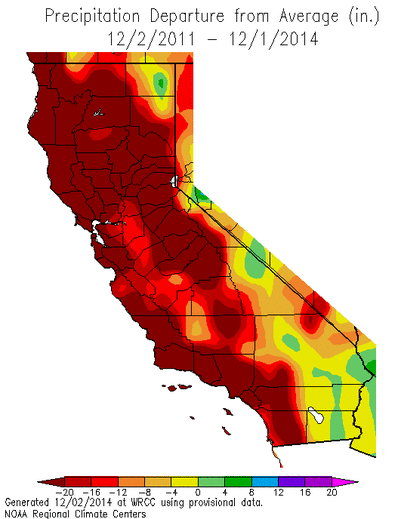
https://twitter.com/NWSSacramento https://twitter.com/NWShanford Turlock got our second good dousing of rain today with just over 0.91" falling between 4:30am and 3:00pm. Although the street drains were not ready to simultaneously handle the rain and huge amounts of sycamore, elm, ash and pistache leaves, this was by no means a drought buster. I did a bit of rooting around on the Western Regional Climate Center to dig-up the average annual rainfall for Turlock and to get a better understanding of the precipitation deficit we're currently running. It turns out Turlock averages 11.83" per year and our three year rain deficit from this drought is somewhere near 12" (based on the best case scenario from the graph below). To better put the information into perspective I tried to teach myself some Google Sheet skills and make a few graphs using data from my fairly reliable weather station. It took a few tries, but here's what I've ended up with. The first graph shows Turlock's rain amounts for each day it has rained this water year. It should be noted that our water year begins on October 1st and ends on September 30th to better coincide with the onset of our rainy season. After today's rain, Turlock has had nine rainy days for a total of 2.82 inches. You can hover your mouse over the different colors on the charts to see how much rain fell on each day. The graph that I will use quite often in my classes is below. It's a comparison of several precipitation numbers for Turlock including an average year of 11.83" (orange), the three year precipitation deficit of 12" (rusty red), and the current tally of 2014-15 rains (optimistic green). By adding the deficit to the average water year I have concluded that Turlock would need to get somewhere in the neighborhood of 24" to even start thinking that the drought is over. As one can see, our 2.82" for the year is still a pittance compared to the 24" pillar of drought that Turlock needs to overcome in order to quench its thirst. And it is quite unlikely. |
Archives
June 2024
AuthorRyan J Hollister - Geoscience & EnviroSci Educator, Avid hiker, Landscape photographer, WildLink Club Advisor, Central Valley Advocate. |


 RSS Feed